
A Review of JavaScript Error Monitoring Services

If you're like me, then you've been diligent about writing the best JavaScript code you can. You lint. You write tests (both for the code and the UI). You check out your site in multiple different browsers, locales, time zones, and dimensions. You do a good job. Rock on, you.

Of course, even the best of us can't test every possible scenario. And let's be frank, I bet there are a few of you, just a few, who test just in Chrome and walk away quickly before even thinking about opening Safari.
For all of us who want a deeper look at how well our sites' code is working, there are now services you can use to help monitor and report on JavaScript issues on your site. In this article, I'm going to quickly go over two such services, covering how they work (spoiler - all pretty much the same), how they report, and finally, what they will cost you if you choose to go into production with them. Let's get started!
TrackJS
For our first service, we'll take a look at {Track:js}. (I'm going to call TrackJS from here on because I freaking hate it when Internet companies use freaky names like this. Yes, I'm an old fart, sorry.)
I was first introducted to TrackJS when I had the good fortune of sitting next to one of their developers at FluentConf this year. He gave me his card and I promised to check it out, not realizing it would take me most of the year to get around to it.
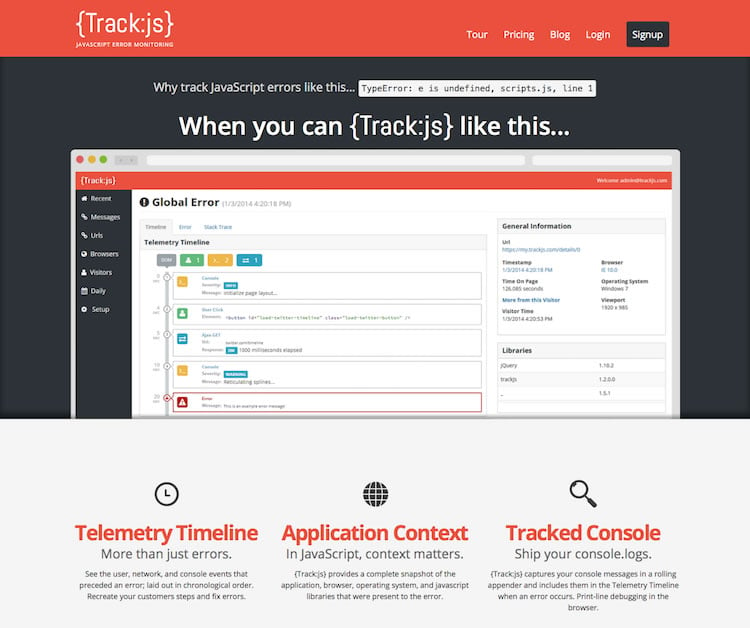
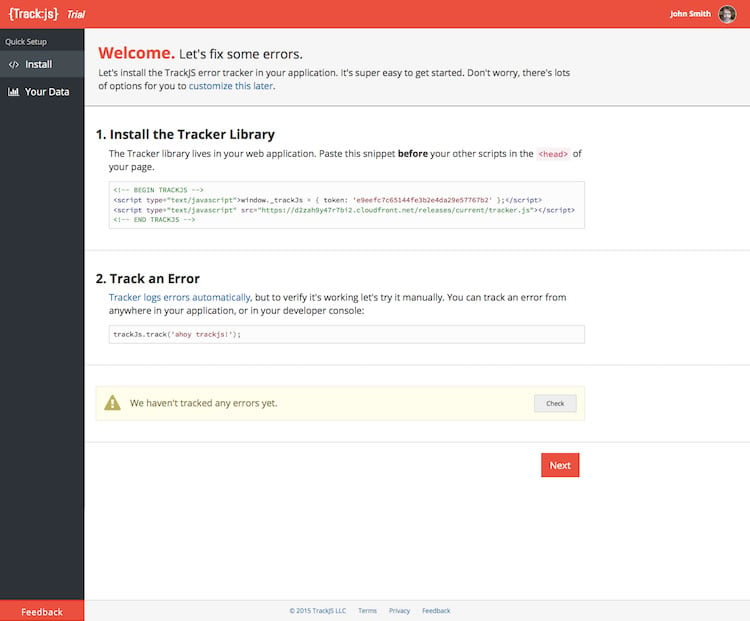
TrackJS provides a free trial with signup, and no credit card is required. Just provide a name and email and you're immediately given code that you can add to your template.
Daily Reports
For my testing, I dropped this into the template for my blog and then promptly forgot about it. Within 24 hours, I began getting detailed email reports about my site. Here is my most recent.
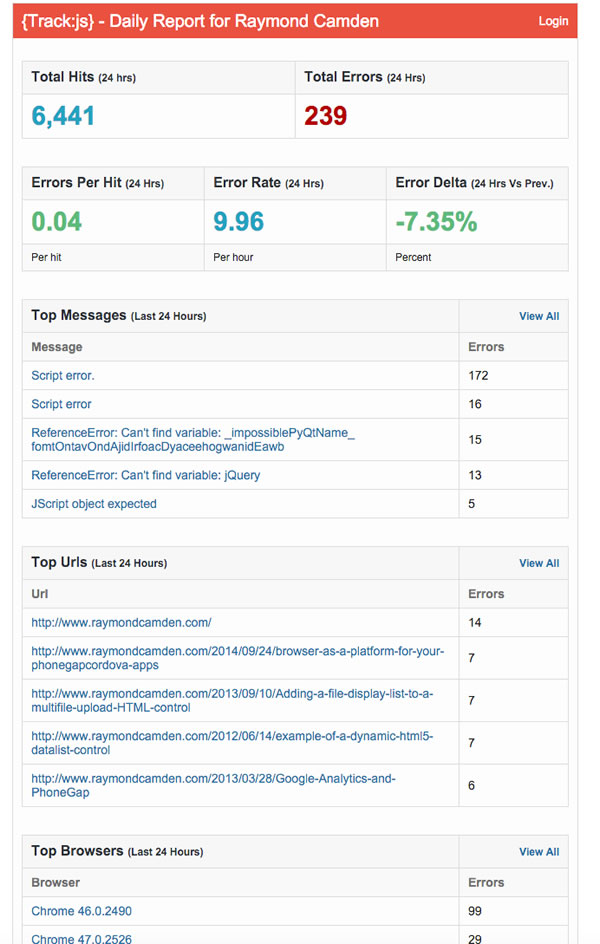
The bottom of that screen shot is cut off a bit, but the "Top Browsers" report is the last part of the email.
As you can see, I've got a good number of JavaScript errors on my site - over 200. But that rate isn't terribly high. While I'd love to say I have no errors at all, it is only 0.04 errors per page view - which is pretty low.
I especially like the delta, although I'm not sure how applicable that is since, in this case, my blog doesn't really change every day. The content surely does, but the actual site code doesn't change unless I add or upgrade a plugin. My take away would be to look out for large deltas, especially after I've updated a plugin or updated WordPress itself.
Dashboard
So how about the web site? Here is the dashboard:
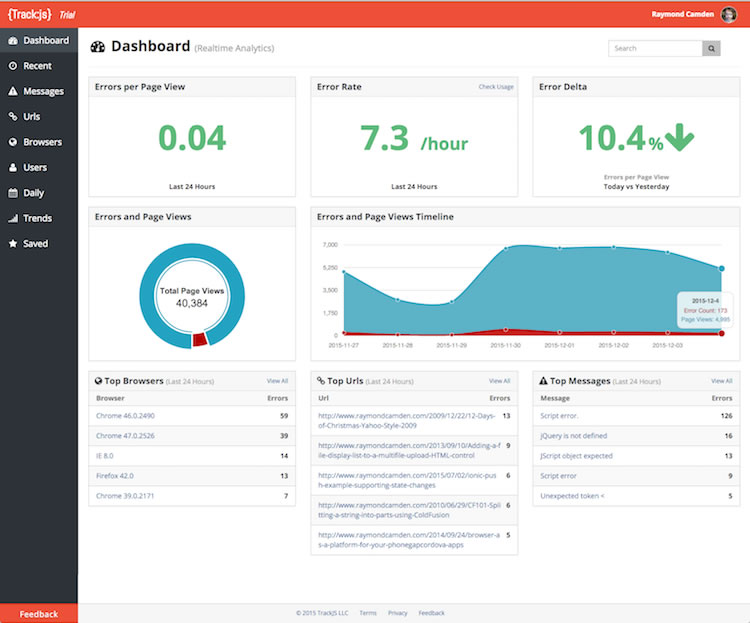
There's lots of good data there, including the fact that folks are still hitting my blog with IE 8, which is kind of depressing.
For the most part you can guess what each of the links on the left hand side provides. I will call out some interesting parts though. First, here is a generic report on one particular error:
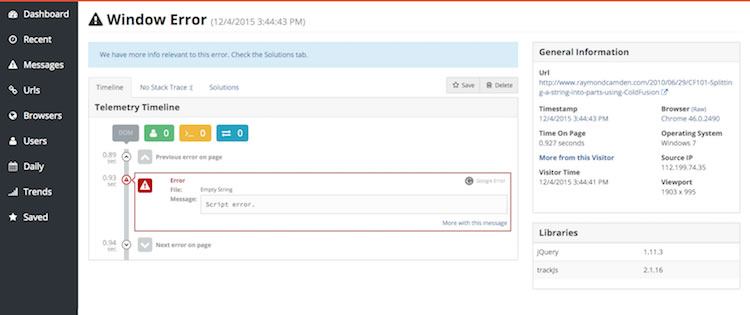
This error, "Script error", is one that is pretty common in my reports. TrackJS knows this and provides details that describes it as (most likely) a third party script not being loaded by the browser. They even offer to hide this error from your reports and from what I can see, this is probably something you'll want to enable. The level of detail is pretty darn incredible though.
Timeline
Here is another one - note the timeline detail.
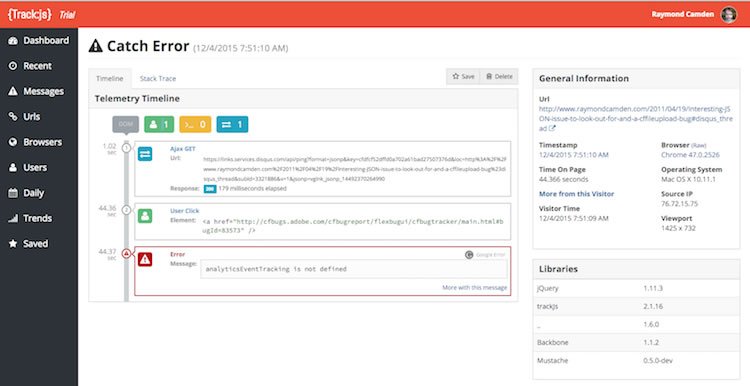
This is pretty darn cool and gives you some idea as to what was going on when the error was thrown.
Moving down the list - I next want to call out the Daily Counts. Check this out:
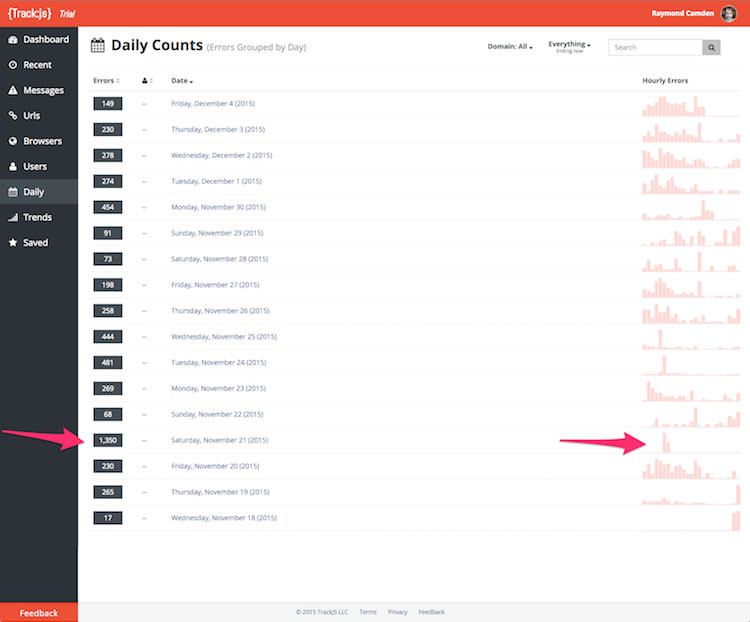
Yeah, something went crazy on Saturday. Notice a huge spike in total errors that was concentrated time wise. Oddly, however, clicking on that sends you to a report of errors listed one by one, not sorted by occurance. I had to go to Messages and use the date filter for that day to figure out the vast majority of my issues were: "Blocked a frame with origin 'http://www.raymondcamden.com' from accessing a cross-origin frame." I noticed they were all on one page where I had used embedded Gists for code blocks. Most likely, something on the GitHub side blocked the embed for a while. And tell me - who is surprised that the biggest issue my blog had recently was because of a third party API/solution?
That sounds like I'm blaming GitHub, and trust me, I think their engineers can get crap fixed a lot quicker than I can, I'm just reminding folks that every time you embed a widget, you put your site in the hands of another.
Trends
One more thing I'd like to highlight is the Trends graph which gives you an idea of whats changing.
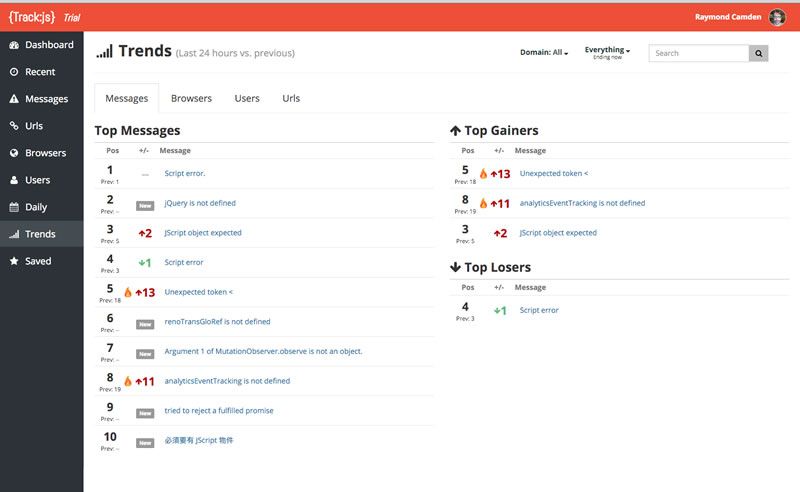
I'll also point out that both of the "hot" errors there are 3rd party embed - one is a Twitter embed and the other Google analytics.
Along with reporting, TrackJS has settings at the project level that include the ability to add other users to the account, specify errors to ignore (good for ignoring things you can't control, like those third party scripts), and setting up notifications. Also, it has a full HTTP-based API that lets you retrieve the error data yourself and build your own dashboards.
Pricing
Ok, so let's talk turkey. As I said, TrackJS has a free trial (30 days). After that trial ends, they support three plans. The Starter plan is the lowest at 30 dollars a month (technically 29.99, but come on, round up) with a max of 100,000 page views per month. My blog would exceed that (approx. 150K page views per month) so I'd need to go the mid-tier at 100 a month for 2.5 million page views. The highest plan, Business, goes up to 10 million page views and both Business and Professional support a higher level of error reporting per minute. You can find more details on their pricing page.
They also specifically call out special support for open-source and non-profit projects.
Finally, I love this FAQ in their pricing page:
What if I exceed my page views? We'll contact you to find the right subscription for your needs. Don't worry, we won't drop your data or impact your sites.
That's just plain nice if you ask me. One last note - and this isn't really scientific - but the one time I had to reach out to them on Twitter (@trackjs), I got a response in about a minute.
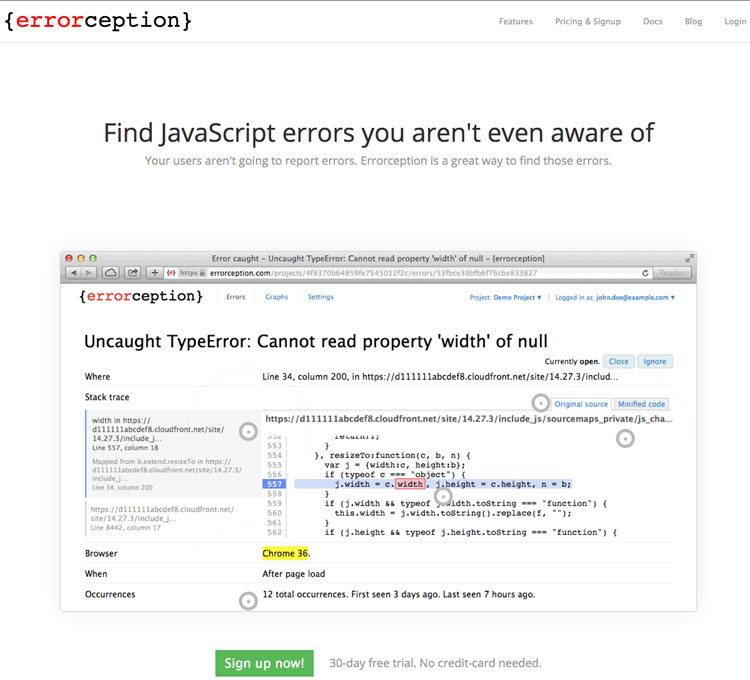
Errorception
For our second service, let's talk about Errorception. This isn't a new service, and in fact, when I first looked into this topic a few years ago, it was the first service I found.
As expected, you can sign up for a free trial (up to 100 errors a day and 30 days duration) and quickly get started by adding their custom code into your site. For my testing, I simply removed TrackJS and added the Errorception code.
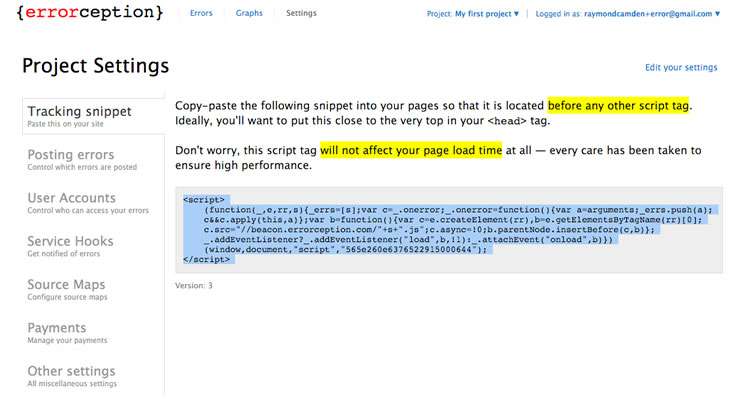
As with TrackJS, you can specify things to ignore, add additional users, and even a web hook URL.
Dashboard
Once you've given time for the service to monitor your site (and again, assuming you aren't perfect), you'll soon have data showing up on the dashboard. This isn't as pretty as TrackJS, but it gets the job done.
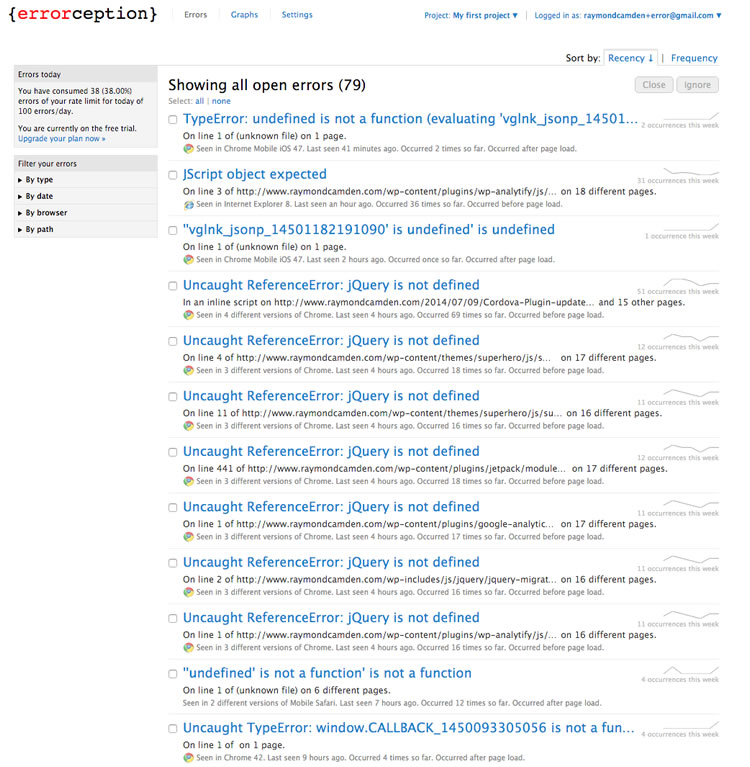
Its a small thing, but I love the little spark lines by the errors showing you the change in occurance over time. The little box on the left hand side has a number of filtering options letting you quickly filter to a particular browser. Oddly, none of the browsers in that list included Mobile Safari or Mobile Chrome. I'd like to see a "Filter by Mobile" in general while I'm thinking about it.
Error Report
Let's look at a particular error report.
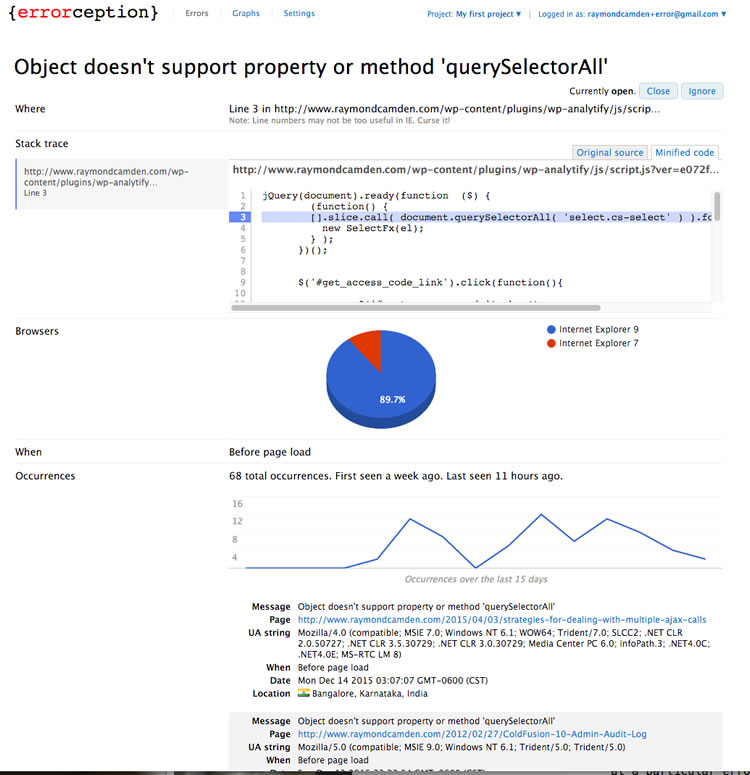
As you can see, this error is being thrown because the browser does not support querySelectorAll (If you don't know what that is, you should really read the docs on querySelector and querySelectorAll). As this function is somewhat new, it isn't surprising to see them failing in older versions of Internet Explorer. I can also tell by the Where portion that it is in a Wordpress plugin. At this point I could report it, but noting that it is a stat tracking plugin I'm not too terribly concerned.
Activity
If you scroll down to the end of the report, you get an Activity portion which has a cool little feature - comments:

While it may not be a killer feature, I love that I can leave a little note right in the report to help myself deal with the issue in the future (or, in this case, remind myself that I don't' care).
The other major part of the UI is the Graphs section. You can't do any filtering here, this is just raw data, and is just focused on reporting which browsers had the most issues.
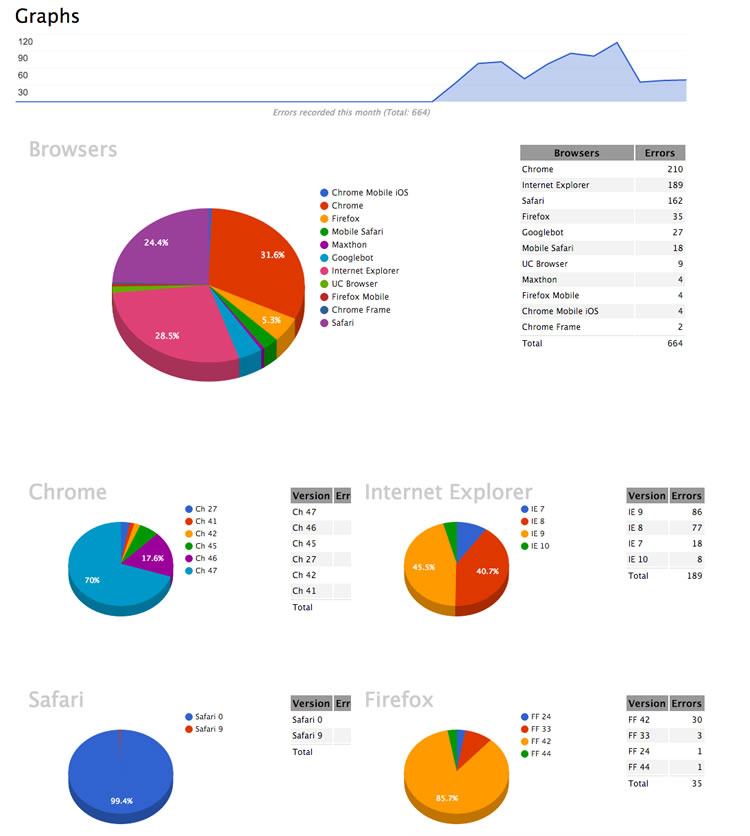
I think this would be more useful if it also reported a ratio. For example, Chrome is showing up as having the most issues with IE coming in second, but I know (err, well, I believe) IE has a lot less traffic than Chrome, so in theory, it is more of a "problem browser" than Chrome is in this case. (To be fair, I'm not picking on IE here. For example, that plugin that uses querySelectorAll was in the middle of a jQuery block. It could have used jQuery for DOM selection instead and worked just fine in IE7 and 9.)
APIs
Errorception has some interesting APIs for use on your code as well. While generally I think the idea with services like this is to leave your own code alone and just let the service pick up and record stuff, you can add some tweaks to your application to better work with Errorception. As an example, you can define your own metadata to be added to the reports. This example, which I'm stealing right from the docs, shows how you can embed a custom email and session ID with the error report.
_errs.meta = {
  email: "email@domain.com",
  sessionId: 4138727492,
  lovesCats: true
};
I could imagine this being useful in cases where the code you use on the front end changes based on something like a user role. So for example, maybe you have users with editorial control over a CMS. By noting their role in the exception data, it would be visible within your reports. Unfortunately I don't see a way to do any filtering by that data, but perhaps that's something I'm missing because I don't have any recorded metadata yet. I saw that metadata was mentioned in their HTTP API docs, but even there you can't do a filter on the values. You would need to retrieve the data and filter it yourself.
Client-Side Error Filtering
Another cool little customization is the allow function. By specifying a function that returns true or false, you can filter errors on the client-side. Again, I'm stealing an example from their docs:
_errs.allow = function(error) {
/*
`error` looks similar to the following:
{
    message: "Uncaught ReferenceError: p is not defined",
    line: 34,
    url: "http://www.example.com/script.js",
    stack: "...stack trace..."
}
*/

return true;  // Allow all errors
}
While I generally don't think you necessarily want to modify your client-side code to be tightly coupled with a particular service, both of these features seem simple enough that I wouldn't necessarily mind them going into my code. More examples can be found on their docs page.
And that is pretty much all. This is definitely a simpler service than TrackJS and could use a few improvements here and there, but it works well and could perhaps be easier to use for some people. Let's talk pricing.
Pricing
Outside of the free trial, there are four different pricing tiers ranging from "Micro" to "Large". Micro is suited for personal sites and is a pretty cheap - 5 bucks a month. The Large tier is 59 dollars a month (nope, not 60, but 59, and yes, I'm showing my old guy crankiness again) and will handle up to 20,000 error reports a day.
Wrap Up
As I stated in the beginning, even with the best of intentions (unit tests, a fully staffed QA department, etc), errors will occur and often in places you least expect. By making use of services like I've described in this article, you can get a handle on what errors are occuring and where you need to direct your testing efforts in the future. Please let me know in the comments what your own experiences are with services like these and if you've found them to be worth their cost.
If you are interested, I previously reviewed another similar service named New Relic Browser. You can read my full review here.
Header image courtesy of Dennis Skley

Raymond Camden
Raymond Camden is a senior developer advocate for Auth0 Extend. His work focuses on Extend, serverless, and the web in general. He's a published author and presents at conferences and user groups on a variety of topics. Raymond can be reached at his blog (www.raymondcamden.com), @raymondcamden on Twitter, or via email at raymondcamden@gmail.com.
Comments
All articles
Topics
Latest Stories
in Your Inbox
Subscribe to be the first to get our expert-written articles and tutorials for developers!
All fields are required