
The Performance of Kendo UI Spreadsheet Versus Office 365 Excel

There was a recent webinar we ran on importing and exporting data using native browser APIs, open source libraries and some of our Kendo UI components. As such, we started to look at creating demos that show importing and exporting data, and decided to look at comparing rendering data with some of the big players, such as Office 365’s Excel Online.
I decided to conduct a performance analysis as there was some immediate feedback from simply using Office 365 and comparing it with our own implementation. I was super impressed by the speed and responsiveness of Kendo UI. This post outlines some of the benchmarking I was able to do by running some rendering and scripting analysis in Chrome Dev Tools.
Setup
Because performance and perceived performance comparisons using two hugely separate resources can be tough. Therefore, we’re going to focus on rendering performance via a few different factors. These include copy and pasting data, rendering cells and highlighting columns, among other things.
We’re not going to be looking at initial load rendering as the two codebases are no doubt served in entirely different ways from different servers and distributions. There are likely also differences in file size and other factors. Essentially, there’s no way to quality control just the raw instantiation of the spreadsheet itself.
Private API calls cannot be assumed as well, therefore we cannot match how one function call implementation compares to another. Both are entirely different codebases and will be architected differently, with Excel Online also being obfuscated.
Column highlighting
First let's assess the basics, starting with the simple but necessary feature of editing spreadsheets: clicking on the top of a column, which in turns highlights the column. Obviously there’s some logic happening behind the scenes to loop through the DOM Nodes and select them, so let’s take a look at a timeline flow of this in Dev Tools.
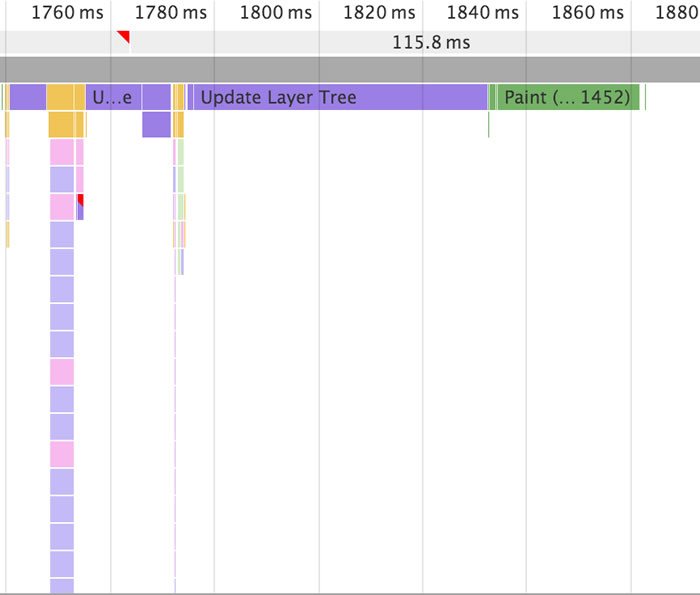
Excel Online
First up, the mousedown event, which the Excel document will start executing the logic to bind selections to each DOM node. This is really fast, 23.66ms in total, but then we see a few DOM layout repaints followed by the mouseup event, a mousemove event, followed by some more repainting amidst other function calls.
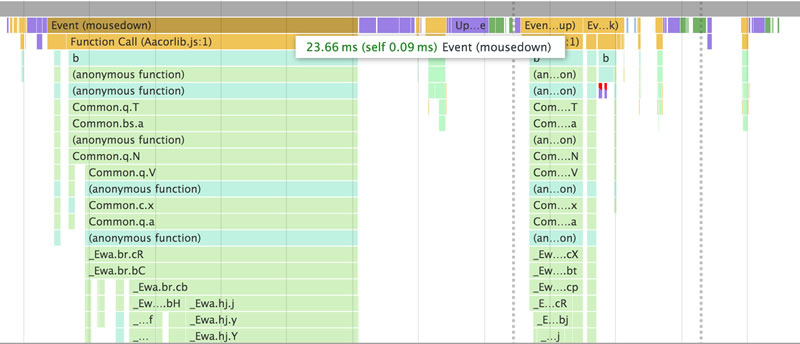
After the mouseup event, you’ll notice two purple bars tied to a JavaScript function call, which have small red highlights. These are forced reflows picked up by Chrome to recalculate styles, which are signs of a slight performance bottleneck on thrashing the layout.
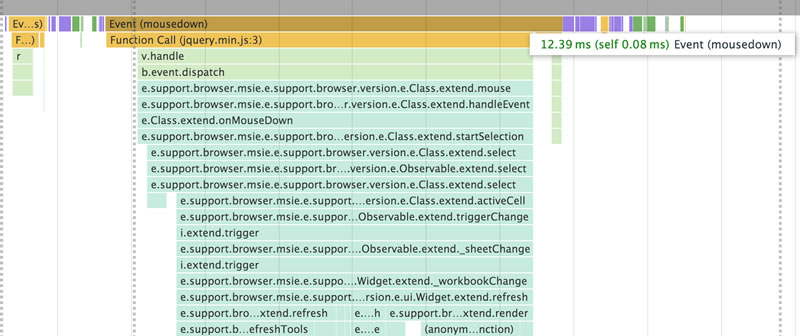
Kendo UI Spreadsheet
With Kendo UI spreadsheet, the mousedown event is almost 50% quicker at finishing up, and has a much cleaner execution in function calls, minimal DOM repaints and layer tree updates.
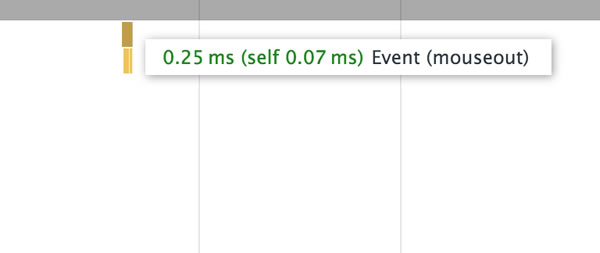
Mouseout events
To record timeline events and JavaScript activity, we have to click a “Record” button inside Dev Tools. I happened to notice that when navigating out of Chrome’s document and back to stop timeline recording, both Kendo UI and Office 365 listen to mouseout events and run some changes, however there’s a significant difference in what happens.
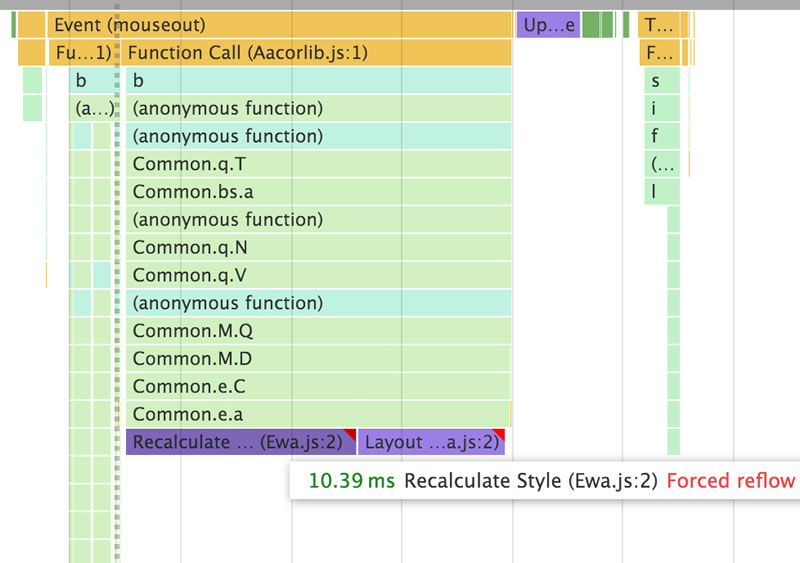
Excel Online
Excel Online is listening to a mouseout event, and binds onto the mouseout to run further processing and recalculating styles. Now, I can’t see the actual underlying code for this because it’s completely obfuscated, however I’m pretty sure that this is verifying that Excel Online’s document fits snug into the window, as resizing the browser repaints the DOM with Excel Online to ensure everything is squashed into view. Again we’re seeing some red flags which indicate potential performance bottlenecks in the thread.
Kendo UI Spreadsheet
With Kendo UI, nothing happens on this mouseout event, there’s no resizing or DOM repainting which is a smoother experience.
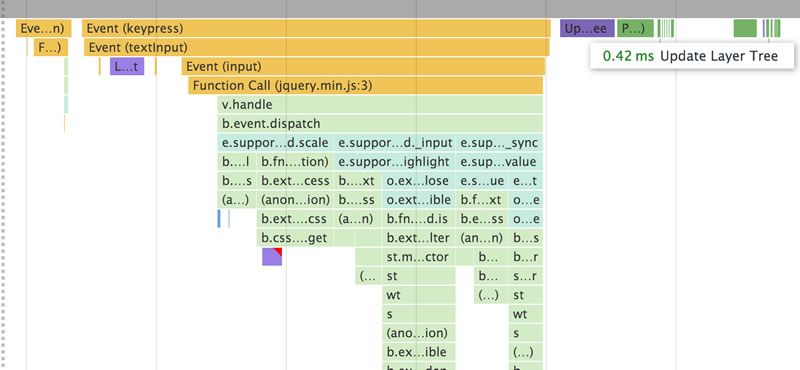
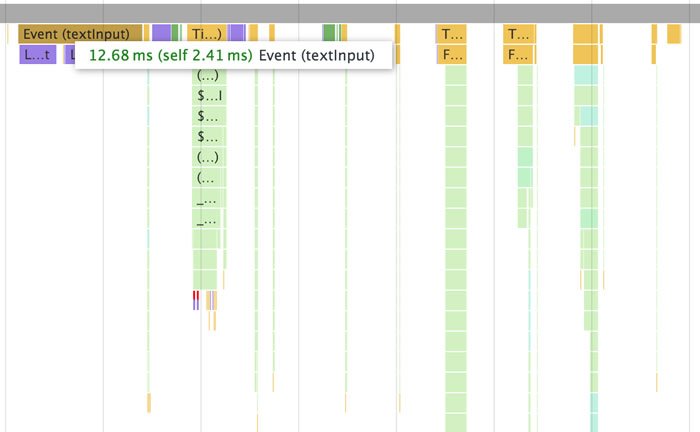
Typing for keyup/keypress event
For this benchmark test, I’m physically typing the word “test” into the same column and row field in both spreadsheet implementations to ensure fair testing, and capturing the events associated with the UI input.
Excel Online
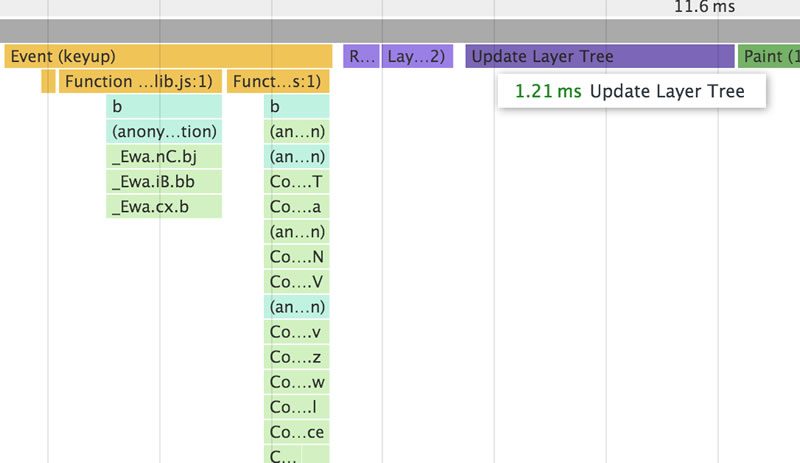
When typing, Excel Online’s events are faster to process than Kendo UI’s by around 50%. Pictured below is the Excel test.
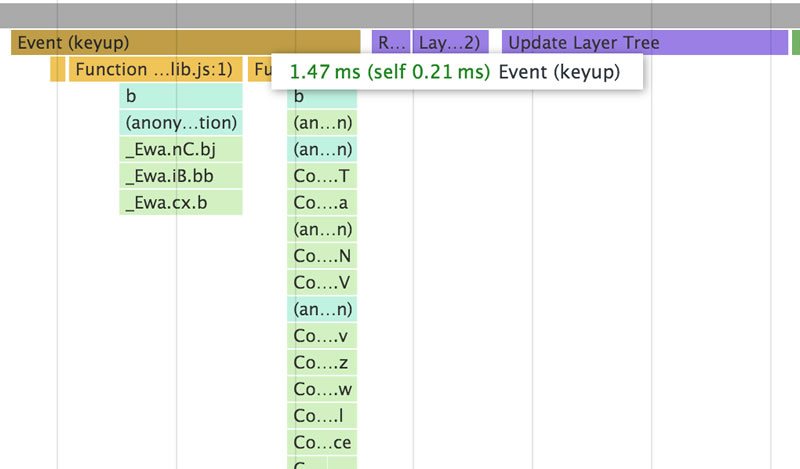
Even though the event processing is faster, there are several recalculations of DOM tree updates: 1.21ms plus another 0.5ms in the separate two purple coloured repaints prior to this, and a final paint (pictured green at the end) costing 0.73ms. The keyup event is 1.47ms total. Total time cost is 3.91ms per keystroke from a keyup event.
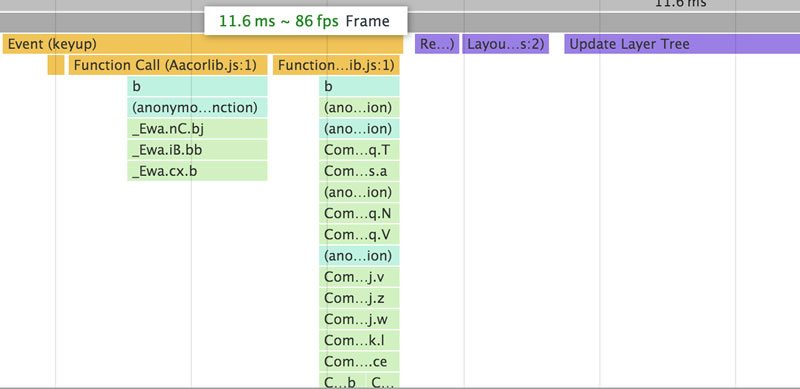
The FPS (frames per second) count during the event for Excel Online reveal approximately a 86fps calculation and rendering performance:
Kendo UI Spreadsheet
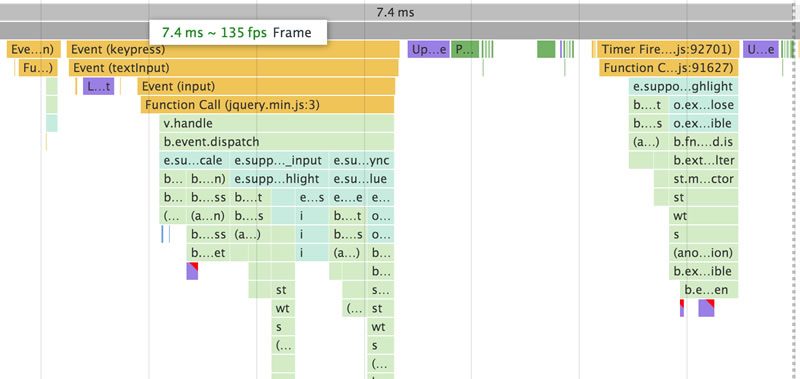
Kendo UI’s implementation takes a lot longer to process the initial keypress event (3.09ms), with a little more happening in the callstack with dispatching of events and input tracking.
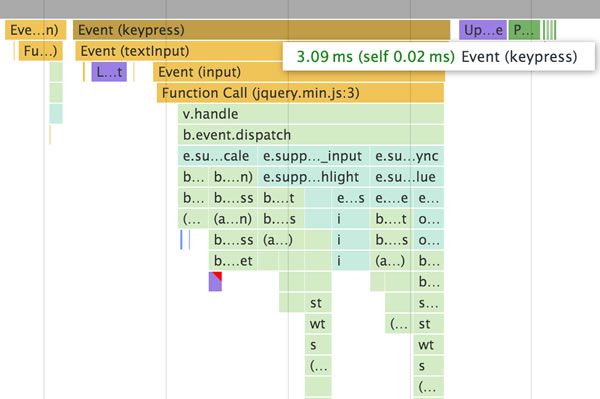
At the end (pictured purple and green), there is 0.39ms taken to update layout (purple at the end), and 0.26ms to run a final paint. Total time spent is 3.74ms.
From a microscopic level, these are essentially the same. However, faster DOM rendering is, in my opinion, a benefit over slightly slower scripting, as the user experiences noticeable UI lag with longer repaints.
Comparing the frame duration, Kendo UI’s is almost 50% smaller, with a much higher FPS rate, sitting at ~135fps, which makes for a much smoother experience for the end user.
Highlighting multiple cells
For this benchmark test, I’m highlighting 10 cells across, and 10 cells down, totalling 100 highlighted squares and their associated events. I have captured the events and rendering associated with the process.
Excel Online
The JavaScript thread is really heavy here, with a ton of processes happening in small chunks rather than batched or throttled for a smoother UI. Chrome is picking up red indicators that signal “long frame times”, which are an indication of jank and poor frames per second for Excel Online.
Whilst dragging across cells in Excel Online, it’s common to see slight lagging. Repaints are highly visible (darkest purple at the top of each frame) at this zoom level, which indicates longer repainting times in the DOM.
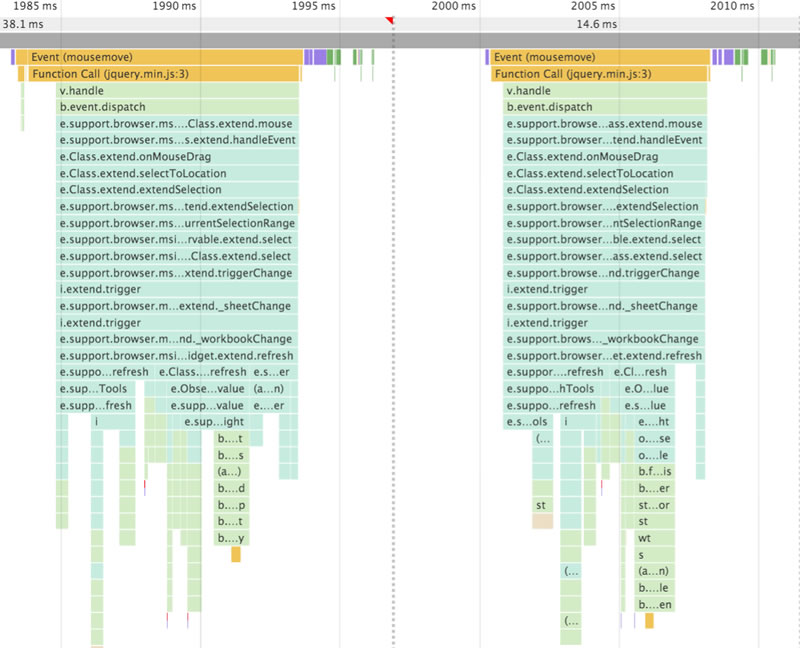
If we dig a little deeper into change rendering for Excel Online, things get a little more interesting in terms of the callstack per each cell’s mousemove event, followed by repainting the DOM. These methods are tiny but there’s a lot of them when compared to Kendo UI’s Spreadsheet implementation, with each frame showing red flags inside Chrome for potential performance bottlenecks. I’d love to be able to inspect the code further, however it’s extremely tiny and minified so I’m unable to look at direct function calls.
From a layout perspective, we’re looking at an average of ~0.12ms to repaint the DOM per mousemove event, which, if you think how frequently the mousemove event fires when dragging, this quickly adds up to seconds in duration.
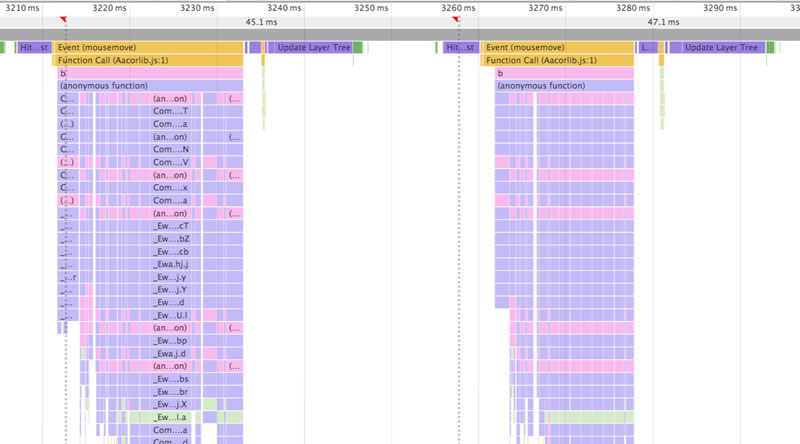
Diving in even further, we can dig in and isolate the final piece after the mousemove event has fired to see a little more information about what’s happening. The purple and green here indicate further layer tree calculations and a final repaint, the total frame duration for the event is ~115ms, compared to Kendo UI’s ~16.5ms that we’ll look at next.
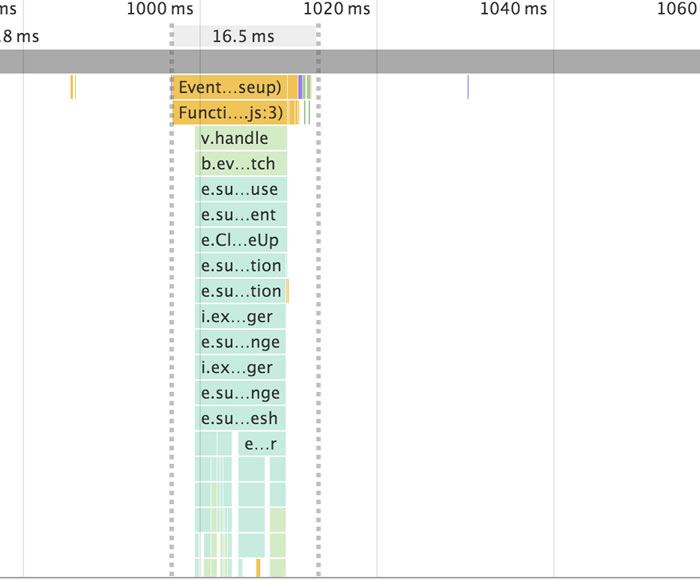
Kendo UI Spreadsheet
If we look at Kendo UI’s implementation of highlighting cells, the events and repainting is extremely minimal. Chrome picks up a few red flags, however comparing the same zoom level frame by frame, there’s a huge difference in function calls, and re-rendering is invisible at this zoom level. This is fantastic for instant user feedback as there will be zero lag in the UI whilst dragging.
If we dive deeper into Kendo UI’s rendering, the repainting is only just visible at a much higher zoom level, with around 0.1ms to repaint the DOM! This is fantastic for a super smooth user experience when handling data and performing basic editing functions.
If we step up the zoom level again to compare with Excel Online, we can see ~16.5ms to complete the entire frame, compared to Excel Online’s ~115ms. 1000ms is 1 second, so you’re looking at 10 mousemove events when dragging (which happens extremely fast) to start to see page janking from Excel’s longer frame rate, layer tree updates and repainting.
Copy and pasting batches of data
For this benchmark test, I’m highlighting pasting this example piece of data into each implementation and capturing the timeline events. We’ll be looking at pasting performance, rendering and display output.
Excel Online
Excel Online is much faster at executing everything over Kendo UI based on the paste event (pictured as the tiny yellow strip before the Event (textInput)). It’s a staggeringly fast 0.04ms, after which it then starts to update all the required DOM nodes to fill in the pasted data.
When it comes to the final output in Excel Online, we can see the following. For all the performance gains, we get zero formatting - pasting data doesn’t format it into what we copied from the sample data.
Kendo UI Spreadsheet
With Kendo UI’s Spreadsheet, we get 783.14ms worth of paste events, which is absolutely huge compared with Excel Online’s benchmark for the paste event of 0.04ms and very fast DOM rendering.
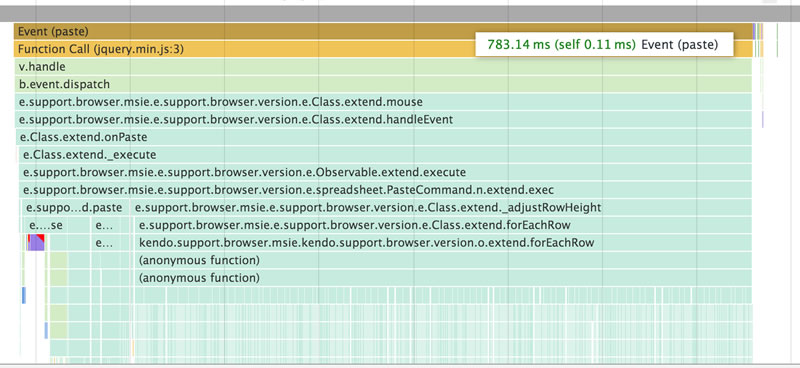
The reason we get 0.7s of paste events is because Kendo UI Spreadsheet is actually pulling in the data in the correct format, with the correct rows and columns formatting. It’s even mirroring the border colors used in the sample piece of data.
Wrapping up
This was a super fun experiment to see how we stack up against Microsoft’s Office Online. It is by no means intended to put down any fantastic work the Office Online team have put into creating the incredible powers behind Excel Online.
Nonetheless, I commend the Kendo UI team for creating a super fast spreadsheet component. It was extremely worth doing some performance testing on basic spreadsheet editing functionality, and it was quite interesting to see that Excel misses out on persisting formatting when pasting data from external sources.
Header image courtesy of Craig Chew-Moulding

Todd Motto
Todd Motto (@toddmotto) is a Google Developer Expert from England, UK. He's taught millions of developers world-wide through his blogs, videos, conferences and workshops. He focuses on teaching Angular and JavaScript courses over on Ultimate Courses.
Comments
All articles
Topics
Latest Stories
in Your Inbox
Subscribe to be the first to get our expert-written articles and tutorials for developers!
All fields are required