
Enhance Your Xamarin.Forms Apps with Charts

You can have your cake and eat it too - that's the promise of Xamarin.Forms by letting you write C# towards making native cross-platform mobile apps. All the while, you can stay in your favorite code editor, reuse libraries and share code (business logic + UI) between apps for iOS, Android and Windows.
If you are displaying data in your cross-platform Xamarin.Forms app, you can improve your app with some awesome charts using Telerik UI for Xamarin. Telerik charts give you everything you expect out-of-the-box – a huge variety of modern charts, superb performance, mobile-specific rendering, easy data bindings and full touch interactivity. This article walks you through how to combine Xamarin.Forms and Telerik Charts to make great cross-platform mobile apps. Let's jump in.
Getting Started with Xamarin.Forms
What is it?
To quote Xamarin:
"Xamarin.Forms is a cross-platform natively backed UI toolkit abstraction that allows developers to easily create user interfaces that can be shared across Android, iOS, and Windows Phone. The user interfaces are rendered using the native controls of the target platform, allowing Xamarin.Forms applications to retain the appropriate look and feel for each platform."
Xamarin.Forms documentation lists the minimum system requirements and supported mobile platforms – you may want to bookmark this and revisit often as you get started.
You can work with Xamarin.Forms on either Windows or OSX with two choices for your IDE:
- Xamarin Studio or the Visual Studio Extension on Windows - This allows you to build Android and Windows Phone apps with ease. iOS development requires a network-connected Mac for builds.
- Xamarin Studio on OSX - This allows you to build iOS and Android apps. Windows Phone apps cannot be built using Xamarin Studio in OSX, although you can open/develop the corresponding project.
How do I begin?
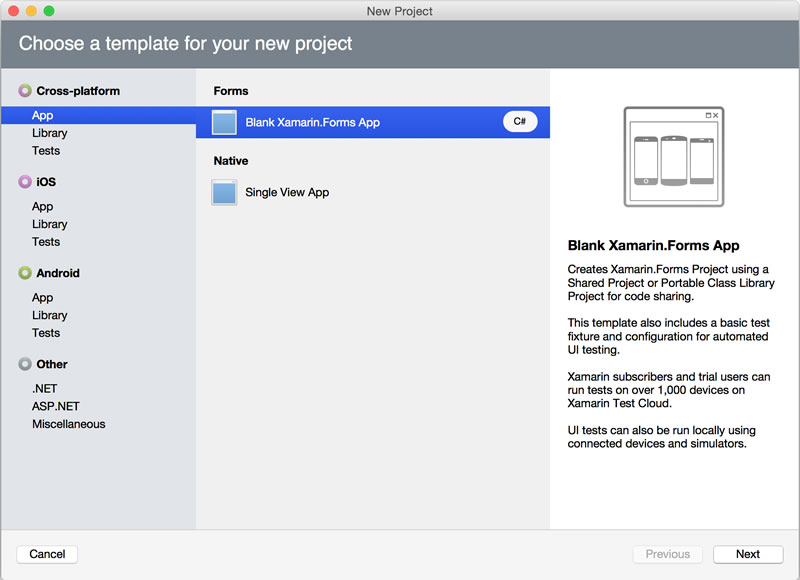
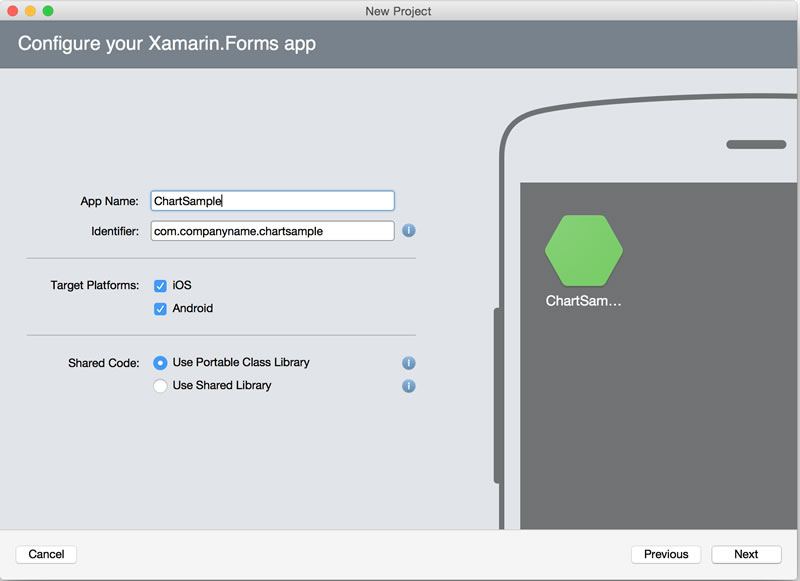
In this article, we're going to concentrate on building an iOS app using Xamarin Studio on OSX. Rest assured, all the code that you see works in either IDE and for each mobile platform. We'll begin by creating a Xamarin.Forms project and configuring the supported platforms, as shown below:
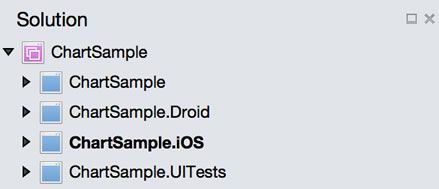
The resulting Xamarin.Forms solution is made up of several projects. There are individual projects for iOS, Android and Windows Phone. These projects hold the platform-specific code and serve as entry points to the corresponding native apps. The shared project is a Portable Class Library – one that is cross-platform and holds the common code between platforms, including the business logic and shared UI. Also, don't forget your Unit Testing project [cough].
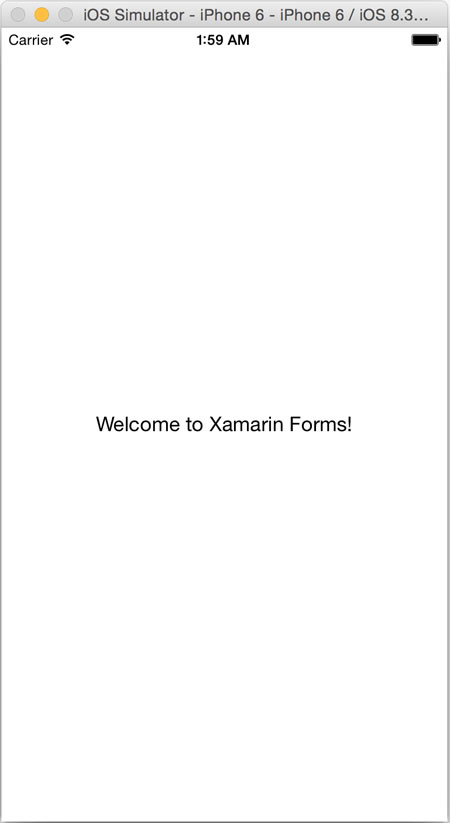
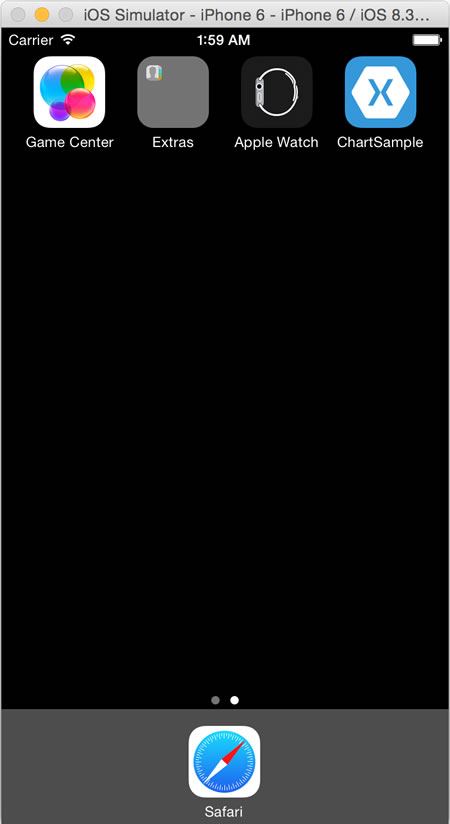
If you have everything in place, you should be able build the project as a whole or launch individual projects through their respective emulators. You can see the iOS version of the app in screenshot below. Notice that your app gets installed in the emulator – yep, this is a true native app.
Building the UI
Xamarin.Forms provides a single API for creating user interfaces, which makes things simple for developers. Your Xamarin.Forms app will likely be a collection of Pages – each representing a single screen in your app. These pages are analogous to an Android Activity, a Windows Phone Page, or an iOS View Controller. You can begin using an assortment of template choices for each Page, as shown below.
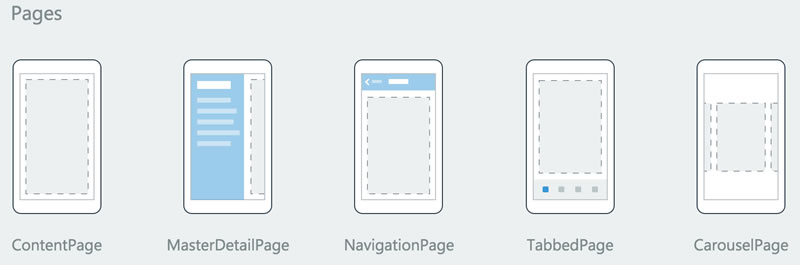
Image courtesy Xamarin
Each Page in your Xamarin.Forms app will likely be made of Layouts – a specialized container view. Layouts house all of the control elements you want to show on screen and provide the canvas for you to paint your dream app. Layout UI is defined in two ways: a XAML-like markup or through C# via a code behind, just like building up a visual tree. You get an assortment of template choices to start building up your Layout, as demonstrated below:
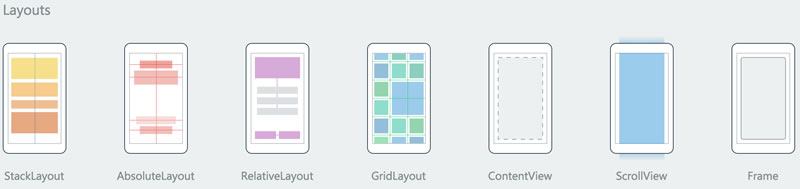
Image courtesy Xamarin
Now that you have your Layout, you'll want to start adding Controls to build the screens of your app. At runtime, each of the Xamarin.Forms controls is mapped to the appropriate native control and that is what will be rendered as your app runs on devices. The screenshot below shows a quick view of all the commonly used Xamarin.Forms controls available to you out of the box. Remember,these are abstractions that render as corresponding Native controls in each mobile platform.
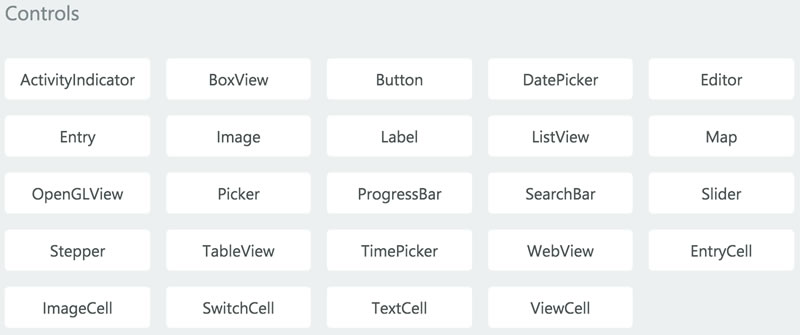
Image courtesy Xamarin
Charts in Telerik UI for Xamarin.Forms
Telerik makes a lot of tools for developers across many platforms, but what Telerik may be most well known for is Charts. With Telerik charts/graphs, you get drop-dead gorgeous visuals that can light up any app – whether web, mobile or desktop.
Enter Telerik UI for Xamarin – a comprehensive suite of polished UI controls for the serious Xamarin developer. You get out-of-the-box native UI controls for your cross-platform mobile apps, each one polished and performance-tuned so you can simply drop them into your apps, as is. There are native UI controls for Xamarin.iOS and Xamarin.Android, but what should interest you the most is Telerik's Xamarin.Forms support.
With Charts in Telerik UI for Xamarin, you get the benefits of using Xamarin.Forms, while rendering polished and flexible charts for all your data display needs. You gain shared business logic and a shared UI that delivers rich chart/graph drawing solutions across iOS, Android and Windows Phone. You can work with Telerik Charts within Visual Studio Xamarin Extension or Xamarin Studio – on Windows and Mac.
How do I begin?
First up, you need to go download the Telerik UI for Xamarin bits – a free trial is a great way to start. Now, there is a lot happening to make the Telerik Charts for Xamarin.Forms work as nicely as they do – and all this functionality is available in a few binaries that you receive in the download.
So, go to the Xamarin.Forms project that you started and add some references to enable the Telerik Charts. The following assembly references need to be added to each of the corresponding projects in your solution – this is important.
-
Portable Class Library Project
- Telerik.XamarinForms.Chart.dll
- Telerik.XamarinForms.Common.dll
-
Android Project
- Telerik.Xamarin.Android.Chart.dll
- Telerik.Xamarin.Android.Common.dll
- Telerik.Xamarin.Android.Primitives.dll
- Telerik.XamarinForms.Chart.dll
- Telerik.XamarinForms.ChartRenderer.Android.dll
- Telerik.XamarinForms.Common.dll
-
iOS Project
- Telerik.Xamarin.iOS.dll
- Telerik.XamarinForms.Chart.dll
- Telerik.XamarinForms.ChartRenderer.iOS.dll
- Telerik.XamarinForms.Common.dll
-
Windows Phone Project
- Telerik.Windows.Controls.Chart.dll
- Telerik.Windows.Controls.Primitives.dll
- Telerik.Windows.Core.dll
- Telerik.XamarinForms.Chart.dll
- Telerik.XamarinForms.ChartRenderer.WinPhone.dll
- Telerik.XamarinForms.Common.dll
In addition, you need to make sure that on app instantiation, the assemblies are loaded with all their functionality available. For the iOS app, there is an AppDelegate.cs file that starts things up. The Telerik assemblies need to be referred here, as well as the binaries invoked inside the FinishedLaunching() method, as seen below. There are corresponding steps for Android and Windows Phone documented here.
using System;
using System.Collections.Generic;
using System.Linq;

using Foundation;
using UIKit;

[assembly: Xamarin.Forms.ExportRenderer(typeof(Telerik.XamarinForms.Chart.RadCartesianChart), typeof(Telerik.XamarinForms.ChartRenderer.iOS.CartesianChartRenderer))]
[assembly: Xamarin.Forms.ExportRenderer(typeof(Telerik.XamarinForms.Chart.RadPieChart), typeof(Telerik.XamarinForms.ChartRenderer.iOS.PieChartRenderer))]

namespace ChartSample.iOS
{
    [Register ("AppDelegate")]
    public partial class AppDelegate : global::Xamarin.Forms.Platform.iOS.FormsApplicationDelegate
    {
        public override bool FinishedLaunching (UIApplication app, NSDictionary options)
        {
            global::Xamarin.Forms.Forms.Init ();

            new Telerik.XamarinForms.ChartRenderer.iOS.PieChartRenderer();
            new Telerik.XamarinForms.ChartRenderer.iOS.CartesianChartRenderer();

            LoadApplication (new App ());

            return base.FinishedLaunching (app, options);
        }
    }
}
You should be all set now. What you have at your disposal is all of the available chart types in Telerik UI for Xamarin, including Cartesian charts with flexible axes, Series charts of various types, scatter and pie charts and much more. Each of the Telerik charts come also with interactive behaviors, like pan and zoom, tooltip, selection and touch sensitivity.
True to the Xamarin.Forms style, you can render the Telerik Charts in two ways – entirely through C# or XAML UI markup. Let's take a look at both approaches.
Cartesian Chart through C#
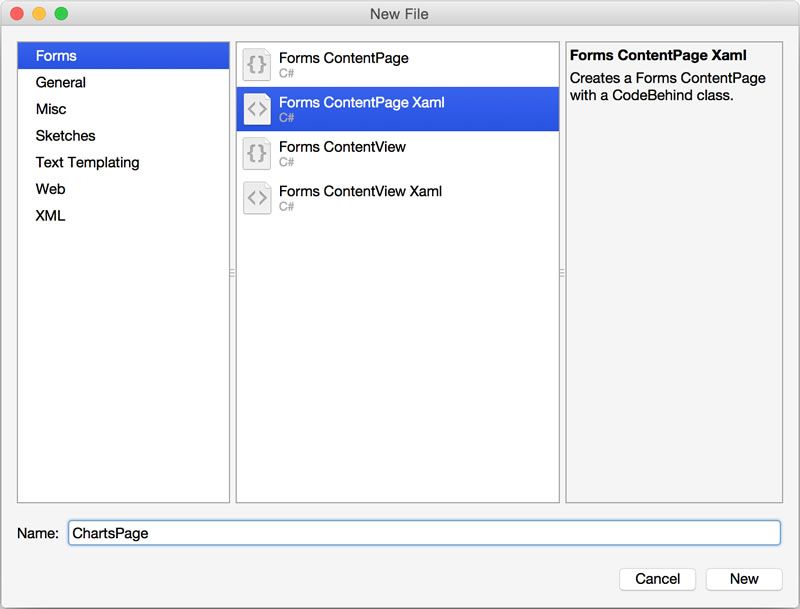
Let's begin with the most common type of cartesian chart – the bar chart. All of the code, including UI, can actually be written in the Portable Library common project, unless you need something very specific to each mobile platform. So, let us add a fresh Page to the Portable Class Library project of the type XAML Content page, as seen below.
Before you go any further, this new Page should be set as the default start-up page for your app. In the PCL project, there should be a CS file with same name as the solution (ChartSample.cs in this case) – this is the platform-agnostic generic starting point for your app. You need to set the MainPage to a new instance of your page to start things off.
using System;
using Xamarin.Forms;
namespace ChartSample
{
public class App : Application
{
public App()
{
MainPage = new ChartsPage ();
}
protected override void OnStart ()
{
// Handle when your app starts
}
protected override void OnSleep ()
{
// Handle when your app sleeps
}
protected override void OnResume ()
{
// Handle when your app resumes
}
}
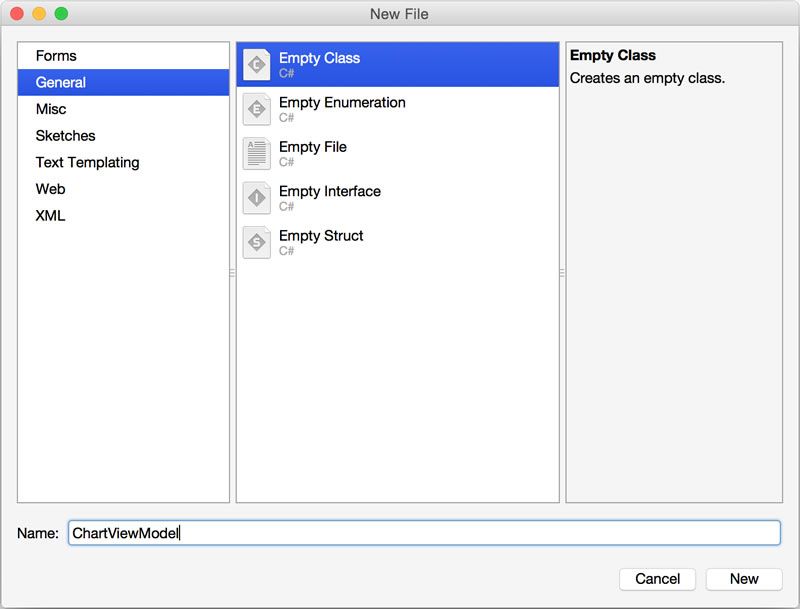
}Before you can render a chart, you'll need some data to bind the chart to. Let's add a ViewModel class to hold your data. It is just a random sample collection as seen in the code below.
using System;
using System.Collections.Generic;

namespace ChartSample
{
    public class ChartViewModel
    {
        public ChartViewModel()
        {
            this.Data = GetCategoricalData();
        }

        public List<CategoricalData> Data { get; set; }

        public string Title { get; set; }

        public static List<CategoricalData> GetCategoricalData()
        {
            List<CategoricalData> data = new List<CategoricalData>
            {
                new CategoricalData { Category = "A", Value = 0.63 },
                new CategoricalData { Category = "B", Value = 0.85 },
                new CategoricalData { Category = "C", Value = 1.05 },
                new CategoricalData { Category = "D", Value = 0.96 },
                new CategoricalData { Category = "E", Value = 0.78 },
            };

            return data;
        }
    }

    public class CategoricalData
    {
        public object Category { get; set; }

        public double Value { get; set; }
    }
}
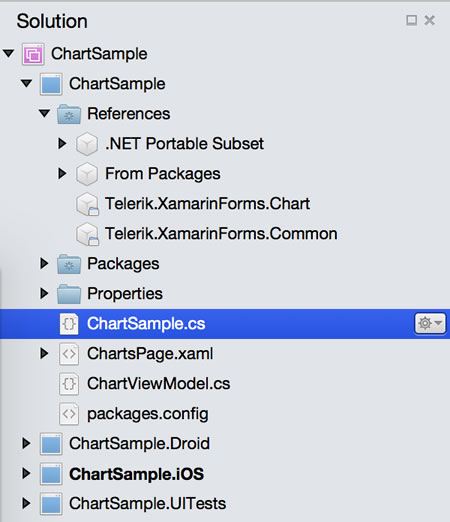
In case you miss a step or run into unexpected errors down the line, now would be a good time to check your project structures. You can see the PCL project with specific Page and ViewModel additions below. Notice the Telerik DLLs in the References.
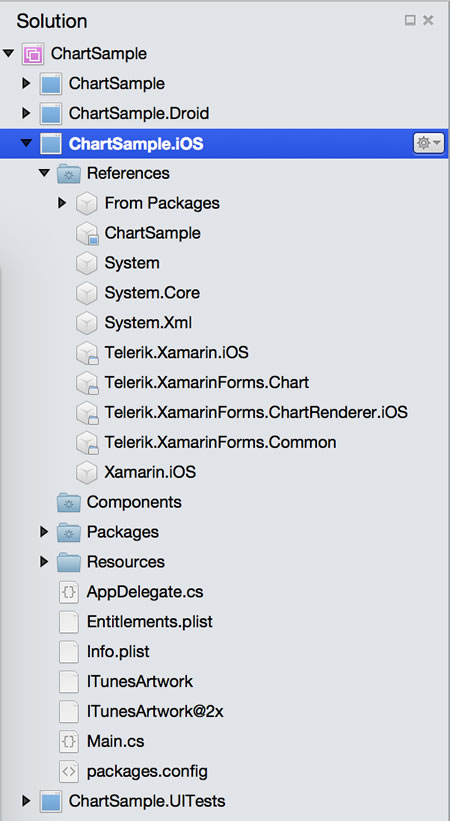
And while you are at it, also check the iOS specific project with the requisite Telerik references. Notice that you are not adding anything to the specific platform projects – 100% code reuse!
Now for the sample Page to demonstrate charts (ChartPage), there is a XAML component and a code-behind CS component. Let us keep the XAML markup empty, other than a Content placeholder, as shown below.
<?xml version="1.0" encoding="UTF-8"?>
<ContentPage xmlns="http://xamarin.com/schemas/2014/forms" xmlns:x="http://schemas.microsoft.com/winfx/2009/xaml" x:Class="ChartSample.ChartsPage">
    <ContentPage.Content>

    </ContentPage.Content>
</ContentPage>
All of the magic can be done in the code-behind CS file, which includes building the UI in C#.
using System;
using System.Collections.Generic;

using Xamarin.Forms;
using Telerik.XamarinForms.Chart;

namespace ChartSample
{
    public partial class ChartsPage : ContentPage
    {
        public ChartsPage ()
        {
            InitializeComponent ();

            this.BindingContext = new ChartViewModel();
            this.Content = CreateChart();
        }

        private static RadCartesianChart CreateChart()
        {
            var chart = new RadCartesianChart
            {
                HorizontalAxis = new Telerik.XamarinForms.Chart.CategoricalAxis(),
                VerticalAxis = new Telerik.XamarinForms.Chart.NumericalAxis(),
            };

            var series = CreateSeries();

            chart.Series.Add(series);
            return chart;
        }

        private static BarSeries CreateSeries()
        {
            var series = new Telerik.XamarinForms.Chart.BarSeries();
            series.SetBinding(BarSeries.ItemsSourceProperty, new Binding("Data"));

            series.ValueBinding = new Telerik.XamarinForms.Chart.PropertyNameDataPointBinding
            {
                PropertyName = "Value"
            };

            series.CategoryBinding = new Telerik.XamarinForms.Chart.PropertyNameDataPointBinding
            {
                PropertyName = "Category"
            };

            return series;
        }
    }
}
You'll notice that the data-binding context is being set to the ViewModel you created earlier, which includes your sample data. Beyond that, you instantiate a Telerik RadCartesian chart, set up its two axes and feed it a BarSeries. The Value and Category properties of the BarSeries point back to corresponding property values in your ViewModel.
That's it – fire up a build and run your iOS app. If everything was done right, you'll have gorgeous Telerik charts lighting up your emulator, as seen below. The best part is – the same code would render the exact same chart on Android and Windows Phone, customized to the look and feel of the platform. You're welcome!
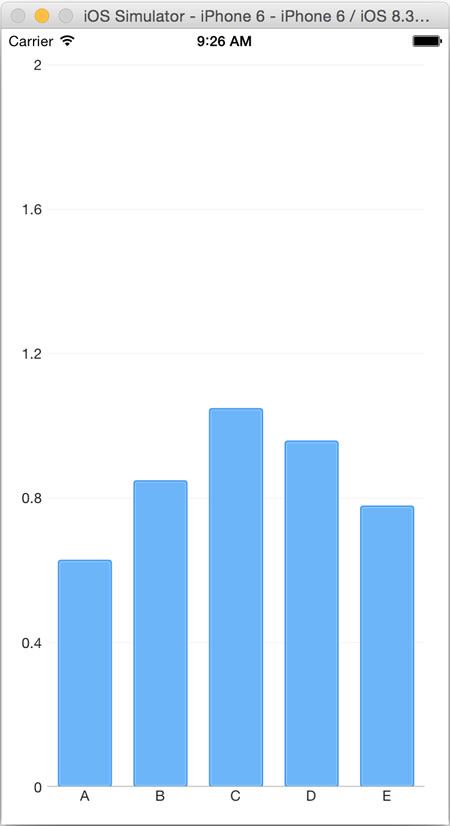
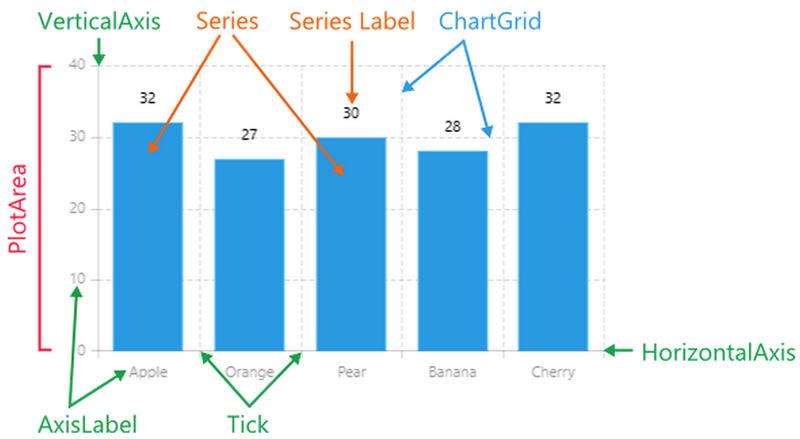
Now this example was an over-simplification. Of course, you can bind the chart to remote data and set other features for each type of chart. Speaking of chart features, the diagram below shows the anatomy of a Telerik chart. Yes, every one of the chart pointers is a property and can be customized to your needs.
Pie Chart through UI Binding
Now that you have seen an example of a Telerik Chart rendered and data-bound entirely through a C# code-behind, it's time to try out the other common way – rendering the UI through XAML markup. This is where you get to see the flexibility of Xamarin.Forms and power of Telerik UI. Let's pick another commonly used chart type – the pie chart.
The pie chart visualizes its data points using a radial coordinate system. Each data point is represented as a slice from a pie. The ratio between the space consumed by each slice and the space consumed by the whole chart is the same as the ratio between the value of the data point that it represents and the total value of all data points in the series.
To keep things fresh, you'll add a fresh XAML ContentPage called PiePage and set it as the app-starting page, as seen in the updated ChartSample.cs code below:
using System;
using Xamarin.Forms;

namespace ChartSample
{
    public class App : Application
    {
        public App()
        {
            // MainPage = new ChartsPage ();
            MainPage = new PiePage();
        }

        protected override void OnStart ()
        {
            // Handle when your app starts
        }

        protected override void OnSleep ()
        {
            // Handle when your app sleeps
        }

        protected override void OnResume ()
        {
            // Handle when your app resumes
        }
    }
}
Next up, define a new PieViewModel to hold your data that is to be used in binding to your rendered PieChart. As you'll notice in the code below, you define a custom class to hold your dataset and set random values to each of the properties. The goal is to demonstrate that you could data-bind Telerik charts to any custom object or datasets in any standard format – local or remotely fetched.
using System;
using System.Collections.ObjectModel;

namespace ChartSample
{
    public class PieViewModel
    {
        public PieViewModel()
        {
            this.Data = GetData();
        }

        public ObservableCollection<OrderData> Data { get; set; }

        public static ObservableCollection<OrderData> GetData()
        {
            var data = new ObservableCollection<OrderData>
            {
                new OrderData { ProductName="Apple", ProductQuantity = 100 },
                new OrderData { ProductName="Mango", ProductQuantity = 50 },
                new OrderData { ProductName="Banana", ProductQuantity = 200 },
                new OrderData { ProductName="Orange", ProductQuantity = 300 },
                new OrderData { ProductName="Watermelon", ProductQuantity = 150 },
            };

            return data;
        }
    }

    public class OrderData
    {
        public double ProductQuantity { get; set; }
        public string ProductName { get; set; }
    }
}
Now compared to the rendering of the initial Bar chart, you'll take a completely different approach in keeping the C# code-behind of PiePage entirely empty, except for setting the all-important BindingContext (data context) that points to a new instance of PieViewModel. In case you wanted a more radical solution, even the data context can be set in the UI markup, leaving absolutely no code in your code-behind.
using System;
using System.Collections.Generic;

using Xamarin.Forms;

namespace ChartSample
{
    public partial class PiePage : ContentPage
    {
        public PiePage ()
        {
            InitializeComponent ();
            this.BindingContext = new PieViewModel();
        }
    }
}
If you're a XAML Pro, you'll love what you can do in the markup with Xamarin.Forms and Telerik UI. As the next step, add XAML markup to PiePage, as seen in the code below. You'll notice how easy it is to render a Telerik PieChart, bind to a data source and set the exact property bindings. Don't forget to set the custom XMLNS to point to the Telerik charts assembly, as demonstrated.
<?xml version="1.0" encoding="UTF-8"?>
<ContentPage xmlns="http://xamarin.com/schemas/2014/forms" xmlns:x="http://schemas.microsoft.com/winfx/2009/xaml" x:Class="ChartSample.PiePage"
             xmlns:telerikChart="clr-namespace:Telerik.XamarinForms.Chart;assembly=Telerik.XamarinForms.Chart">
    <ContentPage.Content>
        <telerikChart:RadPieChart>
              <telerikChart:RadPieChart.Series>
                <telerikChart:PieSeries ItemsSource="{Binding Data}" >
                      <telerikChart:PieSeries.ValueBinding>
                        <telerikChart:PropertyNameDataPointBinding PropertyName="ProductQuantity"/>
                      </telerikChart:PieSeries.ValueBinding>
                </telerikChart:PieSeries>
              </telerikChart:RadPieChart.Series>
        </telerikChart:RadPieChart>
    </ContentPage.Content>
</ContentPage>
That's all the code you should need. Fire up the iOS app and you should have a gorgeous Telerik PieChart that is bound to your custom ViewModel.
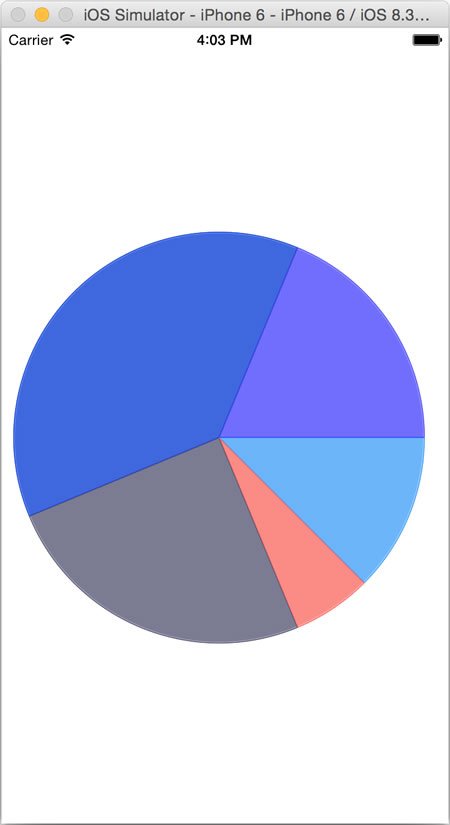
Does it feel like you're missing something? Yep – there are no labels on the pie chart. Go back to your XAML markup and add a ShowLabels property.
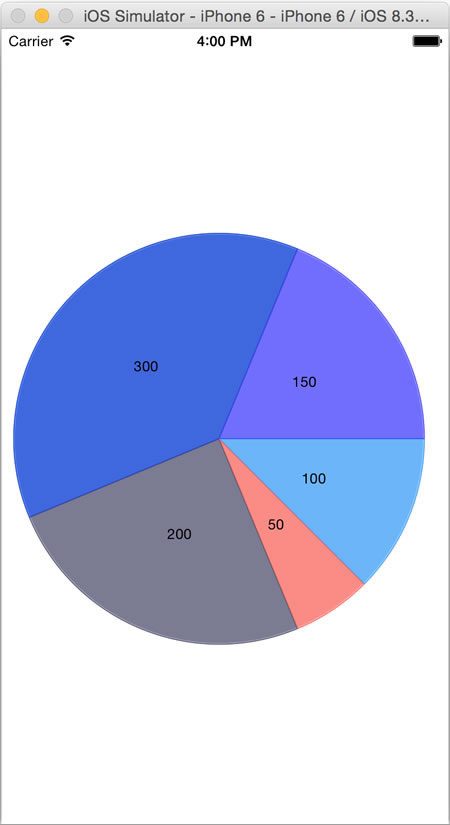
<telerikChart:PieSeries ItemsSource="{Binding Data}" ShowLabels="true">
...
</telerikChart:PieSeries>
And just like that, the labels show up in your pie chart. You can customize the pie chart in other ways as well and have huge flexibility in the types of data you could bind the chart to.
Conclusion
The best of both worlds – that's what you get when you combine Xamarin.Forms with Telerik UI for Xamarin. On the one hand, you get the flexibility of rendering your UI through either a C# code-behind or pure XAML UI markup. Telerik charts and graphs, on the other hand, totally light up your bland data display with polished modern visualizations.
What you get out-of-the-box with Telerik charts in UI for Xamarin is superb performance and out-of-the-box full touch interactivity. And remember, the end result is a truly native app for iOS/Android/Windows Phone. Test it out with a free trial today. You get to build truely native cross-platform apps with C#/XAML and brilliant charts to impress your users – life is good.

Sam Basu
Sam Basu is a technologist, author, speaker, Microsoft MVP, gadget-lover and Progress Developer Advocate for Telerik products. With a long developer background, he now spends much of his time advocating modern web/mobile/cloud development platforms on Microsoft/Telerik technology stacks. His spare times call for travel, fast cars, cricket and culinary adventures with the family. You can find him on the internet.
Related Posts
Comments
All articles
Topics
Latest Stories
in Your Inbox
Subscribe to be the first to get our expert-written articles and tutorials for developers!
All fields are required